Methods of Communication
Research and Statistics
Online Workbook
About SPSS
Watch the following micro lecture about how to open an existing data set in SPSS.
In statistics, we always work with variables: characteristics that give units of analysis values. In SPSS, the statistics software that we use, variables appear in the columns in the data matrix, units in the rows, and values in the cells. The names of the variables appear above the columns. In SPSS, you can also add extra descriptions for the variables and the values, known as labels.
Data in SPSS
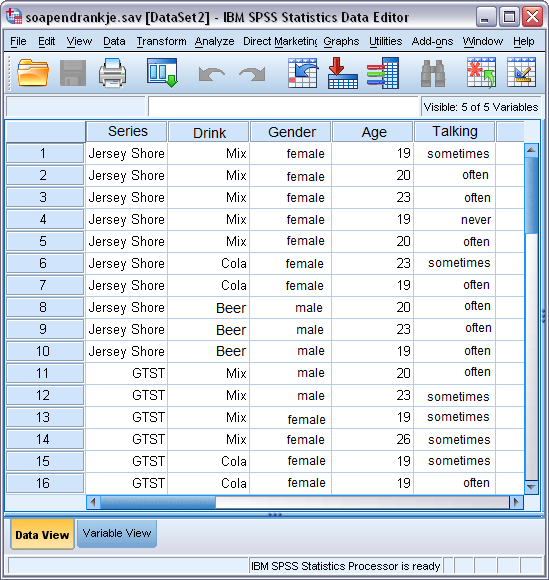
The data in SPSS consist of variables on which the units of analysis have gained different values, or in other words: the data matrix. The data matrix is visible in the SPSS Data View. The units are the rows, the columns the variables, and the values (data) are in the cells. Using the Data View (see image), we can establish that our first unit of analysis is a 19-year-old female. Her favourite TV show is Jersey Shore and her favourite drink is a mixed drink.
Watch the following micro lectures to learn more about the data view and variable view.
How do I create a new SPSS file?
In the File menu, select New and then Data. SPSS then generates an empty data matrix, which you can populate as you wish. There are two things that you must do: 1) Define the variables (columns) (give them a name, and possibly create labels for both the variables and values, including the type of variable; see the micro lecture about the variable view for advice on how to do this) in the Variable View, and 2) enter the data in the cells in the Data View.
Entering and saving data
Data can be entered directly into the data matrix. When typing in numerical data, you are advised to use your numeric keypad and to use the cursor keys to navigate to the various cells in order to avoid excessive mouse usage. If you want to enter letters or combinations of letters and numbers, you first need to change the settings to alphanumeric variables. To do this, click on the button with three points in the Variable View tab in the Type column. This opens the Variable Type dialogue box, in which you then select the String option. Then indicate the total number of letter positions you intend to use. Under the File option, save the data by clicking Save (if you do not want to change the existing file name) or Save as (if you want to give the file a new name).
How do I enter values and value labels?
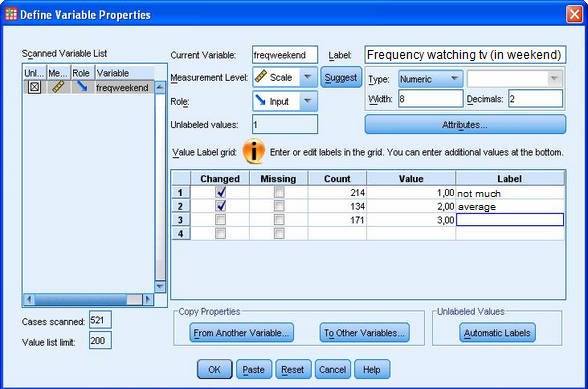
There are two ways of creating values and value labels; we will show you both. We prefer the first method because it allows you to make a syntax for creating the labels (see under 'What is a syntax?'). The first method runs via Data --> Define Variable Properties. This also enables you to list various values as 'missing' and to save their syntax. Open the Define Variable Properties menu and select the variable(s) for which you would like to add value labels. Click OK and a screen will appear in which you can edit the variables. Here you can add the variable name, the variable label, and the value labels. When you add a label, SPSS automatically checks the box next to it, so you can see that you have changed it. Now click Paste to make a syntax of this process, run it, and save it.
For the sake of completeness, we will also show you a second way of attaching value labels. But we repeat that we strongly recommend using the first method above. For the second method, select the Variable View in the main SPSS screen. You can now enter values and value labels by clicking the button in the Values column. The following dialogue box will then appear:
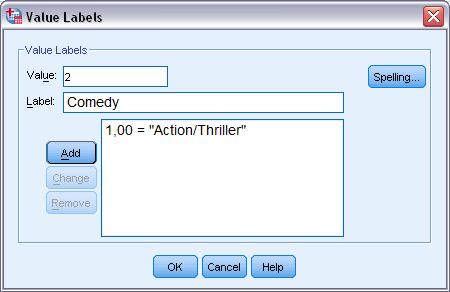
Suppose you have coded the genres in the data matrix as follows: 1 = Action/Thriller, 2 = Comedy, 3 = Science Fiction, 4 = Romantic and 5 = Other. You can enter a code on the top line of the dialogue box. Below this, you can enter a description of the code (value), such as the description 'Action/thriller' for code '1'. Once you have entered each code and description, click on the Add button. Both will then appear in the bottom-most field. You can now fill out another pair, e.g. code '2', description: 'Comedy', and click Add. When you have finished entering the labels, click OK to return to the previous dialogue screen.
Types of screen
In SPSS, you will work in three types of 'screen' - in the database itself (which consists of the Variable View and Data View tabs), the output, and the syntax. These will be shown on your task bar, like website pages, at the bottom of your computer screen (assuming you are using a Windows computer). The first time you conduct an analysis, the syntax will start up automatically (see below for what a syntax is and does); after this, you will always have to start it up yourself. The output shows all the calculations in your analyses, such as graphs and contingency tables. It will open automatically every time you run a syntax. The 'Analyse' command button, which you use to start almost every analysis, appears on every screen.
Watch the following micro lectures to learn more about syntax and output in SPSS.
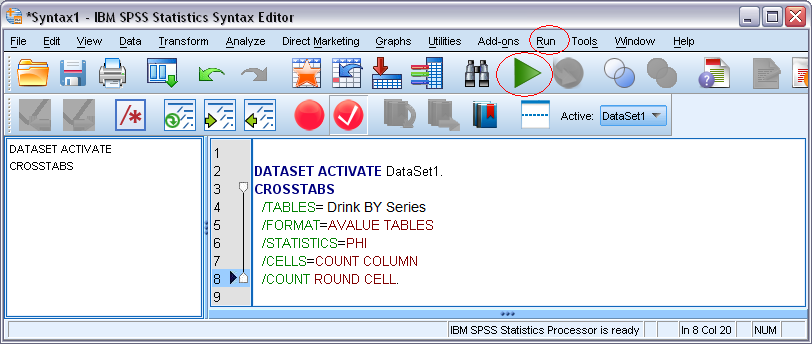
To get SPSS to conduct an analysis, you must first select the command and click Run.