Methods of Communication
Research and Statistics
Online Workbook
|
SPSS exercise 2.10
For this exercise, you are going to make a small database yourself. Open SPSS and click on Enter data in the opening screen.
a. Insert the following data of five research units in an SPSS file.
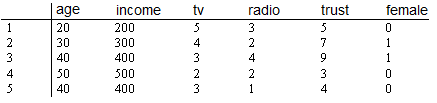
- age: age measured in years;
- income: income measured in number of euros per (unknown) unit of time;
- tv: number of hours spent watching TV per week;
- radio: number of hours spent listening to the radio per week;
- trust: trust in the media, measured in points on a scale of 1 to 10;
- female: 0 = no, 1 = yes.
b. For the variable 'age', use SPSS to calculate the mean ( ), the variance ( ), the variance ( ), the standard deviation (s) and the standard scores (z-scores). For the standard scores (z-scores), give only the minimum and maximum scores. Always round off to two decimal places (so write 1.20, for example, not 1.2). ), the standard deviation (s) and the standard scores (z-scores). For the standard scores (z-scores), give only the minimum and maximum scores. Always round off to two decimal places (so write 1.20, for example, not 1.2).

c. For the variable 'income', use SPSS to calculate the mean (), the variance (), the standard deviation (s) and the standard scores (z-scores). For the standard scores (z-scores), give only the minimum and maximum scores. Always round off to two decimal places (so write 1.20, for example, not 1.2).
d. For the variable 'tv', use SPSS to calculate the mean (), the variance (), the standard deviation (s) and the standard scores (z-scores). For the standard scores (z-scores), give only the minimum and maximum scores. Always round off to two decimal places (so write 1.20, for example, not 1.2).
e. For the variable 'radio', use SPSS to calculate the mean (), the variance (), the standard deviation (s) and the standard scores (z-scores). For the standard scores (z-scores), give only the minimum and maximum scores. Always round off to two decimal places (so write 1.20, for example, not 1.2)
f. For the variable 'trust', use SPSS to calculate the mean (), the variance (), the standard deviation (s) and the standard scores (z-scores). For the standard scores (z-scores), give only the minimum and maximum scores. Always round off to two decimal places (so write 1.20, for example, not 1.2)
g. Compare the variables with each other as regards their standard scores (z-scores). Is there anything in particular that you notice?
h. For the standardised variables, use SPSS to calculate the mean, variance, standard deviation. Is there anything in particular that you notice?
j. For the variables 'age', 'income', 'TV', 'radio', 'trust', and 'female', calculate - this time without the help of SPSS - the mean, variance, standard deviation, and z-scores. Compare the results with those of SPSS.
Hints
1 Data in SPSS
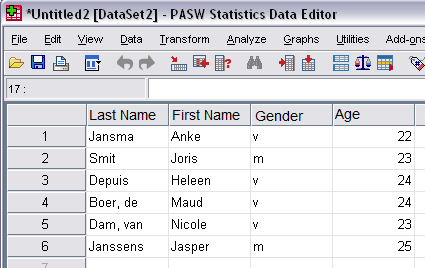 The data in SPSS consist of variables where the units have gained values; in short, the research data matrix. The data matrix is visible in the SPSS Data Editor (see image).The units are the rows, the columns are the variables, and the values (data) are in the cells. The data in SPSS consist of variables where the units have gained values; in short, the research data matrix. The data matrix is visible in the SPSS Data Editor (see image).The units are the rows, the columns are the variables, and the values (data) are in the cells.
Using the Data Editor, it is possible to determine that Heleen Depuis is a woman and that she is 24 years old. It can also be established from column 3 that the number of female students is greater than the number of male students in the first nine units of analysis.
2 How do I make a new SPSS file?
In the File menu, select the New option and then Data. SPSS then shows an empty data matrix, which you can fill in as you wish. Bear in mind that there are two things you have to do: define the variables (columns) - (give them a name and - optionally - specify the labels of the variables and the values, as well as the type of variable) and fill in the data in the cells.
3 Entering and storing data
Numbers can be entered directly into the data matrix. Move the black block in the data matrix with the cursor keys or the mouse to the desired cell. If you want to enter letters or combinations of letters and numbers, you first need to change the settings to alphanumeric variables. To do this, click on the button with three points in the Variable View tab in the Type column. This opens the Variable Type dialogue box, in which you then select the String option. Then indicate the total number of letter positions you intend to use. Under the File option, save the data by clicking Save (if you do not want to change the existing name) or Save as (if you want to give the file a new name).
4 How do you calculate measures of central tendency and measures of dispersion in SPSS?
Measures of central tendency and measures of dispersion are calculated in SPSS under Analyse -> Descriptive Statistics -> Frequencies -> Statistics.
The Dutch terms are:
- Modus: Mode.
- Mediaan: Median.
- Gemiddelde: Mean.
- Interkwartiel Afstand: Interquartile Range: Calculate it yourself, with the help of the quartiles Quartiles, where the halfway point should be between the difference of the third percentile (Percentile 75) and the first quartile (Percentile 25).
- Standaard Deviatie: Standard deviation (Abbreviation: Std. Deviation).
- Variantie: Variance.
5 What do we mean by the standard deviation, the variance, and the interquartile range?
The standard deviation, the variance, and the interquartile range are all measures of dispersion. A measure of dispersion is a number that shows how far apart the results are from each other and/or from the mean. One number therefore serves to demonstrate the usefulness of the mean.
The standard deviation is the most commonly used measure of dispersion. It is calculated by extracting the root from the variance. The greater the standard deviation, the more the values differ from each other, and the fewer values that equal the mean there are. Analyse -> Descriptive Statistics -> Frequencies -> Statistics -> Std.deviation
Quartile: a quarter of the observations are below the first quartile; three-quarters of the observations are below the third quartile. The interquartile range is calculated as follows: the third quartile (percentile 75) minus the first quartile (percentile 25), divided by 2. Analyse -> Descriptive Statistics -> Frequencies -> Statistics -> Quartiles
6 What are z-scores?
Z-scores are standardised scores of a variable that we can calculate for every unit of analysis. Standardisation makes it possible to compare the values of variables that have different measurement units. The z-scores are based on the standard deviation and the mean of a variable shows how many times the standard deviation of the score of the relevant unit of analysis deviates from the mean of a variable. A negative z-value means that the value of the unit of analysis for that variable is less than the mean of the group, and a positive z-value means that it is greater than the mean of the group. Therefore, z = 1 means that the value of the unit of analysis on the variable is one standard deviation greater than the mean, and z = -2 means that the value is two standard deviations less than the mean.
7 How do you calculate z-scores in SPSS?
When you calculate z-scores in SPSS, they are added to the data matrix. To have the z-scores calculated, follow this procedure: Analyse -> Descriptive Statistics -> Descriptives. This is where you enter the variables for which you want the z-scores, and then check the 'Save standardized values as variables' box.
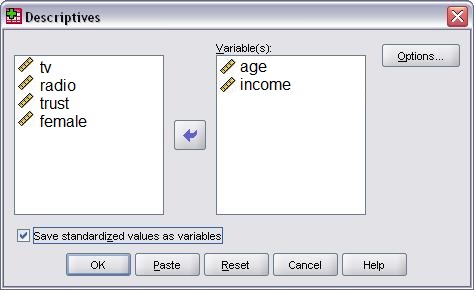
Clicking on OK will then add the z-scores to the data matrix.
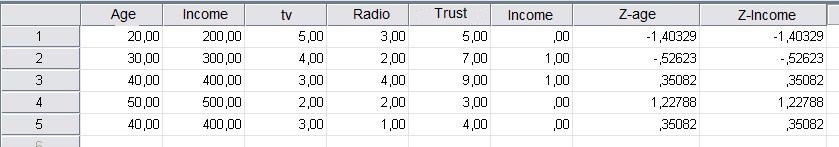
SPSS will itself give a name to the new variables; in the above case, Zleeftijd for the z-scores of age and Z inkomen for the z-scores of income.
|