Methods of Communication
Research and Statistics
Online Workbook
|
SPSS exercise 2.9
For this exercise, open the MediaUse.sav database again.
a. Calculate once again the mean number of minutes spent watching television on working days (v5min), but now for men and women separately. Do this using Means. Put the syntax into the answer field.

b. What conclusion can you draw? In your answer, state also the mean number of minutes for men and women and the standard deviation (round off to two decimal places).
c. Check also whether there are any differences in the number of minutes spent watching television on working days among groups who read a newspaper. In order to be able to do this, you need to use the variable you have already made, in addition to the variable v7. What conclusion can you draw? State in your answer what newspaper is read by the respondents who watch the most television on average, and what newspaper is read by the respondents who watch the least television on average. Do not forget to state the standard deviation for these newspapers!
Hints
1 How do I compare means between separate groups?
As well as calculating a mean for one variable for all units of analysis, it is also possible to compare the mean of the separate groups. Suppose you have had calculated the mean number of hours that people spend watching television. The mean appears to be 2.19 hours. This mean covers every respondent in your sample. In the example below, a calculation has been made of how many hours men and how many hours women spent watching television, on average. To do this, you use the command Means in SPSS. You do this via Analyse -> Compare Means -> Means.

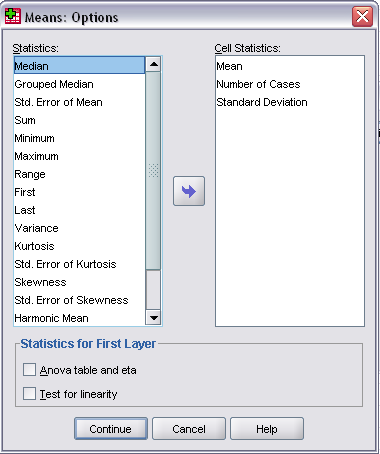
SPSS will then ask you in the Means window to state what the independent and what the dependent variable is. If you want to compare the mean television viewing times of men with those of women, then 'gender' is the independent variable. The dependent variable is the number of hours that is spent watching television. With the Options screen, it is possible to state which information SPSS has to show (see the illustration below).In this case, we want the average (Mean) and the total number of respondents (Number of Cases) to be shown.
SPSS now gives the following output:

This output shows that in total, 521 respondents were surveyed, who watch television for an average of 2.19 hours. The average viewing time for women (Mv=2.16) is lower than that for men (Mm=2.22).It is also possible to compare the average number of hours' viewing time of other groups with each other, such as different levels of education:
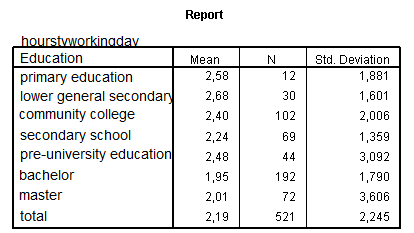
The overall mean remains the same, of course (M = 2.19).On average, people with a MAVO education watch television the longest (Mlo = 2.68) and those with an HBO education the shortest (Mun = 1.95).
|