Methods of Communication
Research and Statistics
Online Workbook
|
SPSS exercise 1.6
Open Mcodata3.sav. For this exercise, you must use a survey conducted by first-year communication science students. The database considers, among other things, people's preferred political party and what they think about politics (and politicians). The political parties in the database are Dutch, hence you might not recognize them. PvdA, for example, is the Labour Party and is a social-democratic political party in the Netherlands. For this exercise it is not important that you know more about the political parties, other than their names.
a. Generate a frequency distribution of the variable 'party'. Compare your syntax to the correct answer.

b. What percentage of the 521 respondents vote PvdA?
c. Suppose that you are interested in voting intentions, and therefore only wish to find out which party people are going to vote for. The calculations in the frequency table concern all the respondents, including those who did not state a preference. What do you need to do to make it meaningful?
d. Make the 'don't know' and 'will not vote' answer categories missing values. Generate the frequency table again for 'party'. What percentage of people who are certain of their voting intentions will vote PvdA?
Hints
1 How do I generate a frequency table?
You generate a frequency table by selecting in the menu Analyse for the option Descriptive Statistics -> Frequencies. This then opens the following dialogue screen. 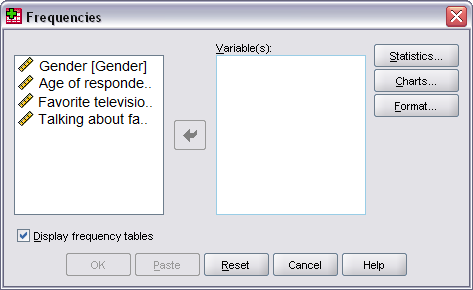
You can move the variables for which you would like a frequency distribution from the left to the right column by selecting the variable (click on it with the mouse) and clicking the arrow between the columns. You can also move the variables from the right to the left column. Again, select the variable and click on the arrow. The arrow now points towards the left-hand column. If you want to move every variable from the left to the right column in one go, select all the variables (hold down the Shift button and move the cursor downwards). Conversely, you can move all the variables from the right to the left column by pressing Re-set.
2 What is a syntax?
A syntax contains the SPSS commands. You do not have to work with syntaxes yet on this course. The only thing you need to know is how to paste a syntax into an answer field, so that we can check whether you have carried out a valid analysis and taken the right steps to arrive at your analysis. When you carry out an analysis in SPSS and confirmed it by clicking on OK or Continue, the results of your analysis will appear in the output screen. In some versions of SPSS (depending on the settings), the syntax appears at the top of the output screen as standard.
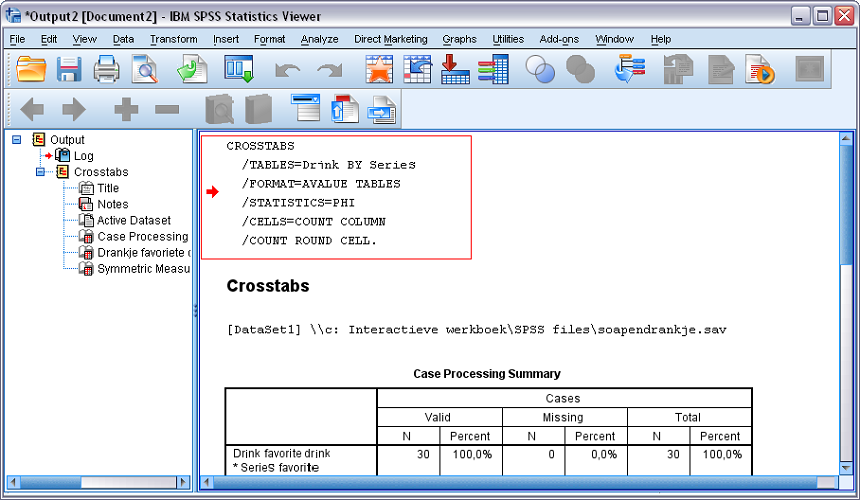
Copy the text that appears at the top to the answer field of the exercise for which the syntax is required. In other words, only copy the text - the syntax - to the answer field, and not the tables!
There is another way of generating the syntax. The main advantage of this method is that you can store the syntaxes separately and make notes in them for a subsequent occasion. Normally, you confirm every analysis that you carry out in SPSS by clicking OK (or Continue). Next to or under the OK button, there is also a Paste button. If you click Paste instead of OK, then a separate syntax window will appear automatically containing the syntax of the command you have given.
Note: You have not yet given the command to SPSS to conduct the analysis! You can now copy the syntax and paste it in the answer field in the interactive workbook (select the syntax and press Ctrl+C, and paste by using Ctrl+V).For SPSS to conduct the analysis, you must first click Run.
3 Univariate table selection chart
| |
Absolute frequencies |
Relative frequencies |
Cumulative (relative) frequencies |
| 1. Select |
1.1 Specifics |
Description: How often does something occur? |
Comparison: Does something occur relatively
more often than something else? |
Minimum/maximum: How many units have a specific minimum or maximum value? |
| 1.2 Minimum level of measurement |
Nominal |
Nominal |
Ordinal |
| 1.3 Options |
A normal frequency distribution has homogenous categories: where there are more than 15 values, group them in heterogeneous categories. The rule of thumb is that the number of categories is the root of the number of units of analysis with a maximum of 15 categories; all categories are usually of the same width |
| 2. Calculate |
Analyze -> Descriptive Statistics -> Frequencies. Group using Transform -> Recode |
| 3. Check |
The table must have a title and, if applicable, an acknowledgement of the source. The totals must be correct. |
| 4. Conclude |
Select a few notable values and mention them, stating what the units are and what the variable means. |
4 What are missing values?
Although we always aim to collect data that is as complete as possible, this is not always possible. There can be various reasons for this. Perhaps some people forget to fill in an answer to a question. Or perhaps they are not willing to say which party they intend to vote for at an election. In surveys, respondents can often state 'I don't know' or 'I would rather not say'. Whether this information is of any use depends on the purpose of your survey. For example, if you want to know how many people are floating voters, then the 'I don't know' option is definitely important. On the other hand, if you want to make a statement about people who do already know that they are going to vote for a particular party, then those who say 'I don't know' are of no interest. However, they are included in the analyses conducted. This can be seen from the differences in percentages between the 'per cent' column and 'valid' per cent in a frequency table (see univariate table selection chart hint!).
It may also be that respondents did not fill in any score on a variable. If you were to ask random people at a bar how old they are, they may prefer not to tell you. This would mean you had no information about the characteristic of age for these people (units of analysis).These are referred to as 'missing values'. However, you do include these people in your research into the characteristics of the people at the bar. But if you want to know the percentage of each age group, you may not always want to include the units of analysis with unknown ages in the calculation of the percentages.
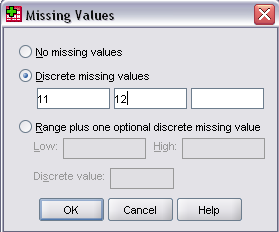
You can therefore tell SPSS to mark units of analysis you wish to temporarily exclude from your analyses as 'missing'. If people do not answer a question (such as in the age example) and therefore no value is entered for that specific variable, it is automatically 'missing'. But if you do not wish to include a certain value in your study (e.g. preferred political party), you must state this explicitly. Do this by going to the SPSS Variable View. When you click in the cell of the 'missing' variable column, you will see dots appear there. Click on them to pull up the 'missing values' screen, where you can state which values of the variable you don't want to include in the analysis.
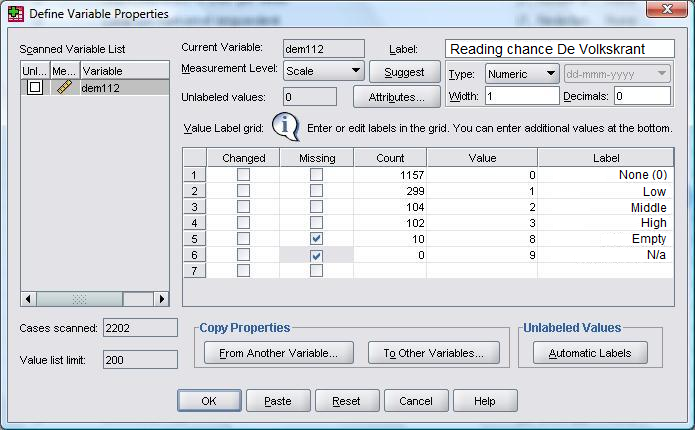
Another way of entering missing values is via Data --> Define Variable Properties. In the screen you can now see, select the variable(s) whose missing values you want to change.
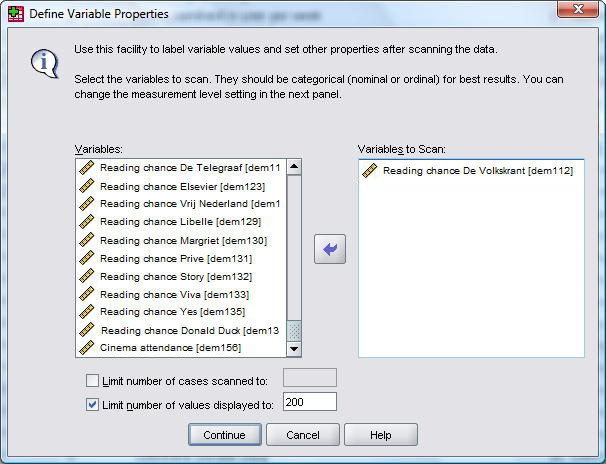
This way enables you to enter different variables at the same time. You do have to go through them one by one, however, by checking the relevant boxes.
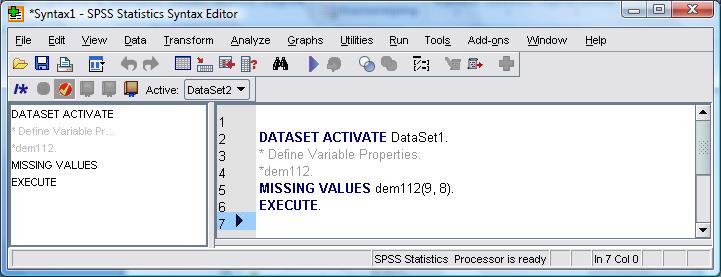
The great advantage of making values 'missing' is that instead of clicking on Continue, you can also click on Paste in order to generate a syntax of this calculation.
|