Methods of Communication
Research and Statistics
Online Workbook
SPSS exercise 6.2
Do older people spend more time watching television than younger people? Or do younger people actually watch more? Is there any difference between watching television on work days and at weekends? Use the following database: McoData2.sav. Use the variables you created in exercise 6.1. again for this assignment. If you have already done this exercise elsewhere, you will have to create the variables again: 'minutes watching television on work days' (v5hour and v5min) and 'minutes watching television at weekends' (v6hour and v6min).
a. Generate a scatter plot with the independent variable being 'age' (v3) and the dependent variable being 'minutes watching television on work days'. Is there a weak, moderate, or strong association?

b. Generate a scatter plot, with the independent variable being 'age' (v3) and the dependent variable being 'minutes watching television at weekends'. Is there a weak, moderate, or strong association?
c. Calculate the Pearson's correlation coefficient for the 'age' and 'minutes watching television on work days' variables and provide your interpretation.
d. Calculate the Pearson's correlation coefficient for the 'age' and 'minutes watching television at weekends' variables and provide your interpretation.
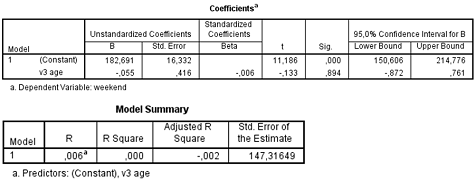
e. Conduct a regression analysis, with the independent variable being 'age' and the dependent variable being 'minutes watching television on work days'. What is the literal meaning of the value of the intercept?
f. What is the value of the unstandardised regression coefficient of the predictor age?
g. What does this value of the unstandardised regression coefficient mean? Mention the variables about which you are making a statement in your answer.
h. What is the value of the standardised regression coefficient?
i. What does this value of the standardised regression coefficient mean?
j. Does age have a significant effect on the number of minutes spend watching television on workdays? Name the value of the statistic and the significance, and what it means for the null hypothesis.
k. Provide your interpretation of the 95% confidence interval for the 'age' variable.
l. On the basis of the confidence interval, can you say something about the significant of the test?
m. What is the explained variance percentage?
n. What does this explained variance mean?
o. Conduct another regression analysis, but now with 'minutes watching television on weekend days' as the dependent variable. Report all the results in APA format.