Methods of Communication
Research and Statistics
Online Workbook
|
SPSS exercise 1.2
For this exercise, you must use a survey conducted by first-year communication science students (MediaUse.sav). This database includes data on, among other things, media usage and demographic characteristics.
a. What are the units of analysis in this study?

b. List the five variables in this database that could be indicators for the concept 'exposure to television'. (N.B. Give the variable name, not the label).
c. Which three variables measure demographic characteristics? List the variable names.
d. Name the labels of the variables that measure demographic characteristics.
e. Generate a frequency table of the variable 'age'. Don’t forget to paste the syntax. Compare your syntax to the correct answer.
Hints
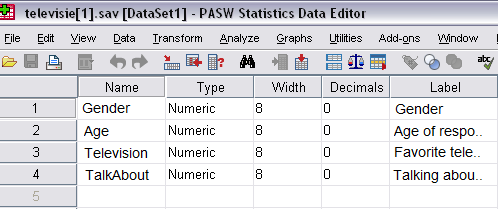
1 What are variables?
A variable is a characteristic of a unit of analysis. Examples of variables in a study in which students are the unit of analysis could be gender, prior education, or choice of study programme.
2 What are labels?
SPSS refers to the description of the name of a variable as a variable label. You can enter this description in the Label column in the Variable View tab
3 How do I generate a frequency table?
You generate a frequency table by selecting in the menu Analyse for the option Descriptive Statistics -> Frequencies. This then opens the following dialogue screen. 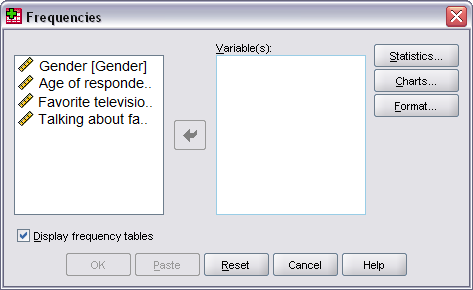
You can move the variables for which you would like a frequency distribution from the left to the right column by selecting the variable (click on it with the mouse) and clicking the arrow between the columns. You can also move the variables from the right to the left column. Again, select the variable and click on the arrow. The arrow now points towards the left-hand column. If you want to move every variable from the left to the right column in one go, select all the variables (hold down the Shift button and move the cursor downwards). Conversely, you can move all the variables from the right to the left column by pressing Re-set.
4 What is a syntax?
A syntax contains the SPSS commands. You do not have to work with syntaxes yet on this course. The only thing you need to know is how to paste a syntax into an answer field, so that we can check whether you have carried out a valid analysis and taken the right steps to arrive at your analysis. When you carry out an analysis in SPSS and confirmed it by clicking on OK or Continue, the results of your analysis will appear in the output screen. In some versions of SPSS (depending on the settings), the syntax appears at the top of the output screen as standard.
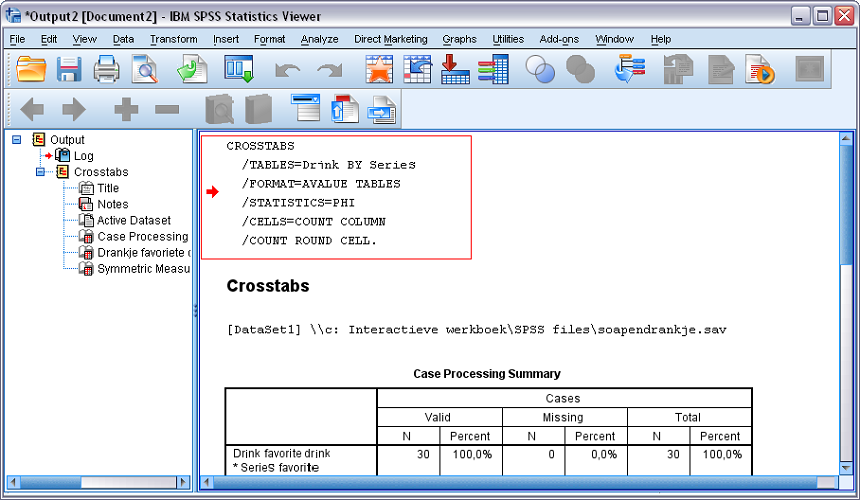
Copy the text that appears at the top to the answer field of the exercise for which the syntax is required. In other words, only copy the text - the syntax - to the answer field, and not the tables!
There is another way of generating the syntax. The main advantage of this method is that you can store the syntaxes separately and make notes in them for a subsequent occasion. Normally, you confirm every analysis that you carry out in SPSS by clicking OK (or Continue). Next to or under the OK button, there is also a Paste button. If you click Paste instead of OK, then a separate syntax window will appear automatically containing the syntax of the command you have given.
Note: You have not yet given the command to SPSS to conduct the analysis! You can now copy the syntax and paste it in the answer field in the interactive workbook (select the syntax and press Ctrl+C, and paste by using Ctrl+V).For SPSS to conduct the analysis, you must first click Run.
|