Methods of Communication
Research and Statistics
Online Workbook
SPSS exercise 1.11
For this exercise, you must use a survey carried out by first-year communication science students. This database (MediaUse.sav) considers, among other things, number of hours worked per week.
a. What is the level of measurement of the 'hours worked per week' (v4hour) variable?

ratio, because you can say that 20 hours worked per week is less than 36 hours, how great the difference is, and negative values are not possible.
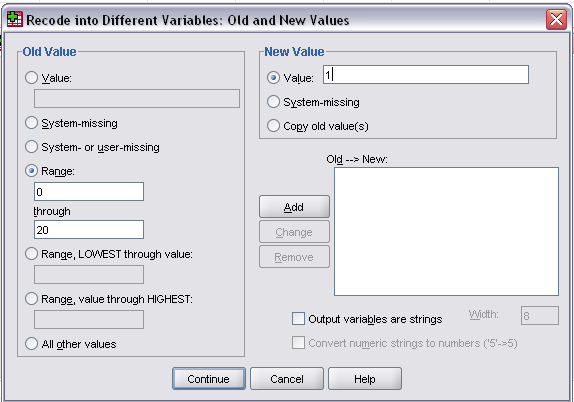
b. Use the 'hours worked per week' (v4hour) variable to make a new variable: 'full-time/part-time'. Name this new variable 'v4hourre'. Use the following groups for this: part-time (from 7 to 30 hours per week) and full-time (30 hours per week or more). Use value 0 for 'part-time' and value 1 for 'full-time'. Compare your syntax to the correct answer.
RECODE v4hour (30 thru Highest=1) (7 thru 29=0) INTO v4hourre.
EXECUTE.
c. What is the level of measurement of the 'full-time/part-time' (v4hourre) variable? Determine the correct level of measurement by answering the questions below.
ordinal, because you can say that full-time is more than part-time but you cannot say what the difference is between these values.
d. What percentage of the people about whom we have information work full-time?
58.9%
Hints
1 How do I recode? Some variables have a lot of values. For example, if you ask a random person how old they are, you would hypothetically get a value between 0 and 117. But if you ask 1,000 people how old they are, you would get a whole range of different values, of which it might prove tricky to get any kind of overview. In such cases, it would be useful to group the values, and to make a new category of that variable. First, list a number of categories on paper, such as: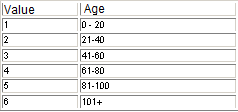

2 What are value labels? Values: Every variable can have a certain value. The variable gender can, for example, have the value 'male' or 'female', and be assigned the code 'm' or 'f' or two different numbers, such as '1' and '2'.
Value labels: Using the Value Labels command, you can attach an explanatory note, or 'label', to a variable's values or codes. In the example of gender, it could be indicated that 'm' means 'male' and 'f' means female. The data matrix automatically shows the value labels (instead of the values or codes entered) whenever you click the button with the label (see below).
3 How do you create values and value labels? There are two ways of creating values and value labels. We will show you both. Since the 'first method' also enables you to generate a syntax for making the labels, this is the one we prefer.
The first method runs via Data -> Define Variable Properties. This way also enables you to list various values as 'missing' and to store their syntax. It is also quicker and less complicated.
When you open the Define Variable Properties menu, select the variable(s) for which you would like to add value labels. After clicking OK, a screen appears in which we can edit the variables:
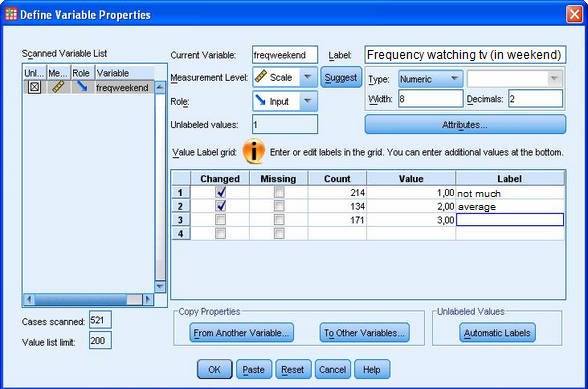
Here you can enter the variable name and label, and the value labels. When you add a label, SPSS automatically checks the box next to it to indicate that you have changed it. Now, click Paste to generate a syntax of this process, run it, and store it. For the sake of completeness, we will also show you another way of attaching value labels. Select the Variable View in the main SPSS screen. You can now enter values and value labels, using the button in the Values column. When you click this button, the following dialogue screen will appear.
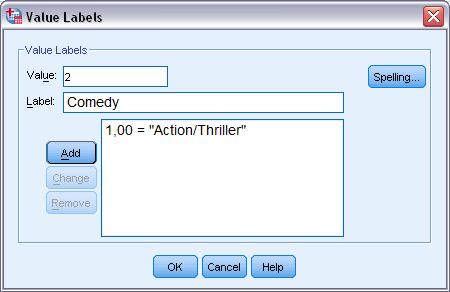
Suppose you have coded the genres in the data matrix as follows:
| Code/Value | Value label |
| 1 | Action/Thriller |
| 2 | Comedy |
| 3 | Science Fiction |
| 4 | Romance |
| 5 | Other |
You can enter a code in the top line of the dialogue screen. Below that, you can provide a description of the code (value), e.g. 'Action/thriller' for code '1'. Once you have entered a code and a description, click on the Add button. The code and description will then appear in the bottom field. You can now fill in another pair, such as code '2' with the description 'Comedy', and add them. When you have finished listing the labels, click OK in order to return to the previous dialogue screen.
4 What is a syntax? A syntax contains the SPSS commands. You do not have to work with syntaxes yet on this course. The only thing you need to know is how to paste a syntax into an answer field, so that we can check whether you have carried out a valid analysis and taken the right steps to arrive at your analysis. When you carry out an analysis in SPSS and confirmed it by clicking on OK or Continue, the results of your analysis will appear in the output screen. In some versions of SPSS (depending on the settings), the syntax appears at the top of the output screen as standard.
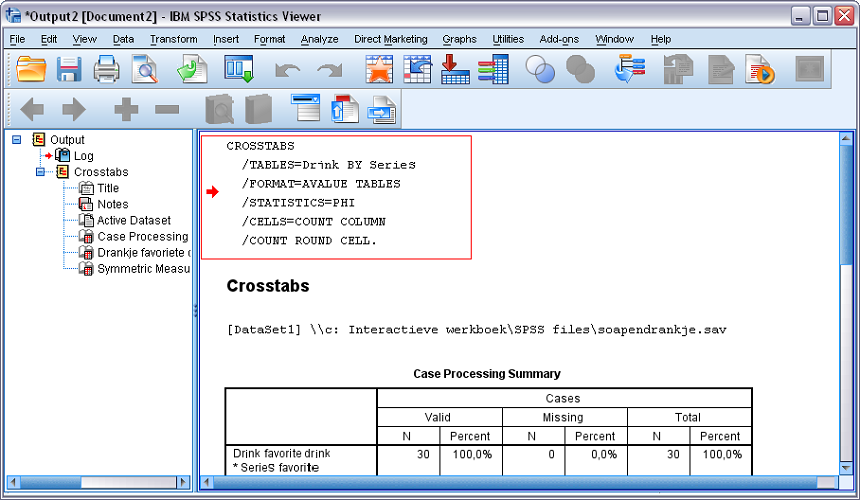
Copy the text that appears at the top to the answer field of the exercise for which the syntax is required. In other words, only copy the text - the syntax - to the answer field, and not the tables!
There is another way of generating the syntax. The main advantage of this method is that you can store the syntaxes separately and make notes in them for a subsequent occasion. Normally, you confirm every analysis that you carry out in SPSS by clicking OK (or Continue). Next to or under the OK button, there is also a Paste button. If you click Paste instead of OK, then a separate syntax window will appear automatically containing the syntax of the command you have given.
Note: You have not yet given the command to SPSS to conduct the analysis! You can now copy the syntax and paste it in the answer field in the interactive workbook (select the syntax and press Ctrl+C, and paste by using Ctrl+V).For SPSS to conduct the analysis, you must first click Run.
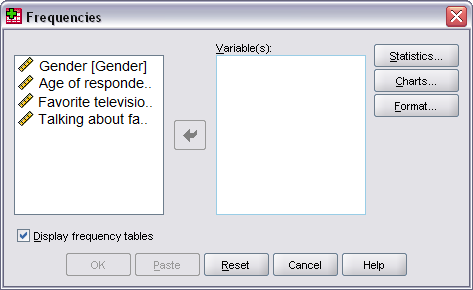
5 How do I generate a frequency table? You generate a frequency table by selecting in the menu Analyse for the option Descriptive Statistics -> Frequencies. This then opens the following dialogue screen.
6 How do I read a frequency table? As can be seen in the table below, in addition to the absolute frequency and the percentage, SPSS gives the valid percentage and the cumulative percentage. In the first column (valid), you can see the values attached to the age variable. The second column (frequency) displays the absolute frequencies - the number of times that a particular value occurs. In this case, the percentages in the fourth column (valid percentage) are identical to the those in the third column (percentage). However, if there are any missing values in your data, there will be a difference between the percentage and the valid percentage. Every person is included in the percentage (including the 15% of respondents who did not answer). As you can see in the table above, the percentage of 19-year-olds is 20%.The question is whether the percentage actually has any meaning, because the three who gave no answer (missing) may also have been 19 years old, but the information on this is missing. That is why it is sometimes better to look at the valid percentage column. This does not take account of people who did not answer. You can see there that 23.5% of those who answered the question were 19 years old.
7 Determining the level of measurement of a variable Nominal scale In a nominal scale, the characteristics are assigned a random value. The sequence of the characteristics does not matter, as can be seen on the scale below. Moreover, the distance between the letters themselves has no real meaning.
3 1 4 5 2
Ordinal scale In an ordinal scale, the characteristics are not assigned a random value, but the scale shows their rankings. This can be seen on the scale below. The values are in alphabetical order. The distance between the letters remains random, however, and without any real meaning.
1 2 3 4 5
Interval scale In an interval level of measurement, the scale indicates a sequence. The distance between the letters themselves also has real meaning. For example, the difference between '2' - '1' = '4' - '3' and the distance '3' - '2' = '5' - '4'. However, there is no zero point. An example of an interval scale is the temperature in degrees Celsius. The difference in temperature between 5 and 10 degrees Celsius is the same as that between 35 and 40 degrees. However, the zero point is random - in other words, 0 degrees Celsius is not the lowest possible temperature. This means that you cannot say that 40 degrees Celsius is four times greater than 10 degrees Celsius, because the relationships between two numbers are not the same (because of the lack of identical distances, and a natural zero point).
1 2 3 4 5
Ratio scale The ratio scale has all the same characteristics of an interval scale. But it also has a natural zero point (0). This means that the differences between the numbers on the scale have a real and identical meaning, as does the relationship between two numbers. Therefore, you can say that a person who has four children has twice as many children as someone who has two.
0 1 2 3 4 5