Methods of Communication
Research and Statistics
Online Workbook
SPSS exercise 6.1
Enter the following data into SPSS:
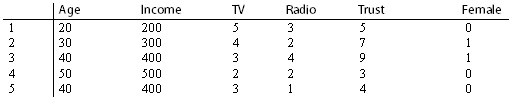
- Age: age measured in years;
- Income: income measured in number of euros per unknown unit of time;
- TV: number of hours spend watching TV per week;
- Radio: number of hours spend listening to the radio per week;
- Trust: trust in the media, measured in points on a scale of 1 to 10;
- Female: 0 = no, 1 = yes.
You might expect that the average amount of time spent watching television on a work day (v5hour, v5min) is related to the average amount of time spent watching television on weekend days (v6hour v6min). Database: Mcodata2.sav.
a. On the basis of (v5hour, v5min) and (v6hour, v6min), create two new variables. One variable for average time spent watching television on workdays, and another for the average number of minutes spent watching television on weekend days. What is the level of measurement of both variables? What is the mean of both variables?

b. What is the null hypothesis that is being tested here?
c. Generate a scatter plot showing both variables mentioned under 1a. Using the scatter plot, give your initial impression of the strength and the direction of the association between both variables.
d. Calculate the correlation coefficient and interpret it.
e. Was the aforementioned expectation correct?