Methods of Communication
Research and Statistics
Online Workbook
|
SPSS exercise 2.5
The survey, on which the WatchAndListenSurvey.sav database is based, measured how often people talk about politics (dem72). However, the sequence of the answer options is not logical: the greater a person's score, the less that person talks about politics.
a. Recode the variable 'dem72' so that the value 1 means 'never', the value 2 'seldom', value 3 'sometimes', and value 4 'often'. Name this new variable 'dem72re'. Do not forget to attach new value labels. Paste the syntax of the recoding into the answer field.

b. Calculate the relevant measure of central tendency and compare your syntax to the correct answer. How should you report the correct measure of central tendency for the new variable in APA format?
c. What conclusion can you draw? Your answer should include the following: the 'content' of the variable, the units of analysis, the correct number for the measure of central tendency, and the interpretation of the measure of central tendency.
Hints
1 How do I recode?
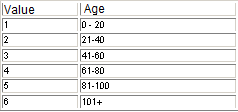
Some variables have a lot of values. For example, if you ask a random person how old they are, you would hypothetically get a value between 0 and 117. But if you ask 1,000 people how old they are, you would get a whole range of different values, of which it might prove tricky to get any kind of overview. In such cases, it would be useful to group the values, and to make a new category of that variable. First, list a number of categories on paper, such as:
Then in SPSS select the procedure Transform -> Recode -> Into different variables. A dialogue screen now appears (see illustration below) in which you first have to select the variable: select the variable in the left-hand list and send it to the right-hand list using the arrow button. You then have to give the new variable a name with the recodes (categories), in the line under Output Variable. You can also create a label here. Don't forget to click Change in order to link the old variable to the new one.

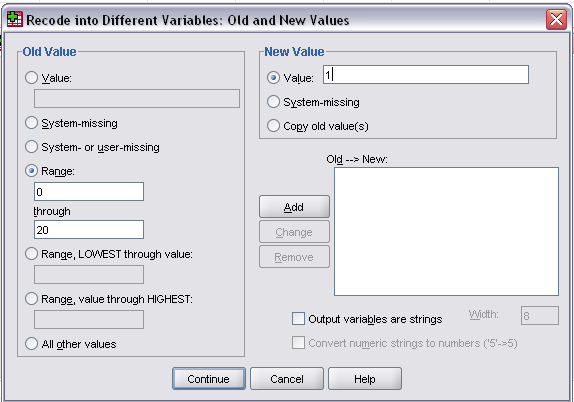
Finally, you need to indicate which old values you want to convert into which new ones. Click the Old and New Values button and a new dialogue screen will appear (see below). This is where you enter your categories. On the left, indicate the categories of the old values (e.g. under Range, the old values from 0 to 20), at the top right you can indicate the new value (e.g. 1, so the old values of 0 to 20 now form category 1). Don't forget to click Add in order to add the recodes to the list to be implemented shortly. When you enter values under Range, fill in the lowest value in the top section, and the highest value in the section beneath that (under 'through'). Here, 'through' means 'up to and including'.
When you have filled in every category in this screen, click Continue and OK in the first screen. SPSS then runs the recode and adds the new variable to the data matrix.
2 Determining the level of measurement of a variable
Nominal scale
In a nominal scale, the characteristics are assigned a random value. The sequence of the characteristics does not matter, as can be seen on the scale below. Moreover, the distance between the letters themselves has no real meaning.
3 1 4 5 2
Ordinal scale
In an ordinal scale, the characteristics are not assigned a random value, but the scale shows their rankings. This can be seen on the scale below. The values are in alphabetical order. The distance between the letters remains random, however, and without any real meaning.
1 2 3 4 5
Interval scale
In an interval level of measurement, the scale indicates a sequence. The distance between the letters themselves also has real meaning. For example, the difference between '2' - '1' = '4' - '3' and the distance '3' - '2' = '5' - '4'. However, there is no zero point. An example of an interval scale is the temperature in degrees Celsius. The difference in temperature between 5 and 10 degrees Celsius is the same as that between 35 and 40 degrees. However, the zero point is random - in other words, 0 degrees Celsius is not the lowest possible temperature. This means that you cannot say that 40 degrees Celsius is four times greater than 10 degrees Celsius, because the relationships between two numbers are not the same (because of the lack of identical distances, and a natural zero point).
1 2 3 4 5
Ratio scale
The ratio scale has all the same characteristics of an interval scale. But it also has a natural zero point (0). This means that the differences between the numbers on the scale have a real and identical meaning, as does the relationship between two numbers. Therefore, you can say that a person who has four children has twice as many children as someone who has two.
0 1 2 3 4 5
3 Measures of central tendency and measures of dispersion selection chart
| |
Measure of central tendency |
Mode |
Median |
Mean |
| Measure of dispersion |
|
Interquartile range |
Standard deviation, Variance |
| 1. Select |
1.1 Specifics |
What occurs most frequently? |
What is the median value? |
What is the balance point of the distribution? |
| 1.2 Minimum level of measurement |
Nominal |
Ordinal |
Interval |
| 1.3 Shape of the distribution |
Usable with every distribution shape |
Usable with every distribution shape |
Not optimal for very skewed distributions |
| 2. Calculate |
Analyze-> Descriptive Statistics -> Frequencies -> Statistics |
Analyze-> Descriptive Statistics -> Frequencies -> Statistics |
Analyze-> Descriptive Statistics -> Frequencies -> Statistics |
| 3. Check |
Unusable with a distribution with many peaks, e.g. in the case of an ungrouped interval variable. |
|
The greater the difference between the mode, median, and the mean, the more skewed the distribution. |
| 4. Conclude |
General:
1. Give your reasons for selecting the measure of central tendency and measure of dispersion (see Select and Check).
2. Use the value of the measure of dispersion to comment on the accuracy of the calculated measure of central tendency: the smaller the distribution, the better the centre typifies the distribution. |
| Mode: "The most common value of variable X is A.". |
Median: "The median value of variable X is A" or "Half of the units of analysis have A or less on variable X, and half of the units of analysis have A or more on variable X."
Interquartile range: "The mean deviation from variable X compared to the median is A" or "The middle half of the observations lies between (first quartile limit) and (third quartile limit).
|
Mean: "The units have an average A on variable X."
Standard deviation, Variance "The mean deviation in relation to the mean."
|
|